Application in the Data center
Energy monitoring software for data centers has a wide range of tasks and is not just restricted to energy efficiency and energy metering. High availability is of the utmost importance in data centers, as each failure costs a lot of money. High availability stands and falls with a reliable power supply and a grid compatibility level which must be maintained. Utilization levels and extreme values of many parameters must be monitored continuously in order to maintain consistent high availability.
GridVis® power grid monitoring software provides tools for all basic key tasks and supports operations with customized functions that are active during business operations. System solutions from Janitza are certified in accordance with DIN EN ISO 50001 and satisfy all requirements of DIN EN 50600-2-2/4-2 for ensuring energy efficiency and power distribution.
Energy efficiency
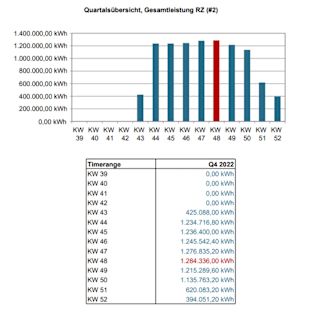
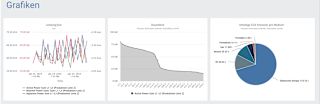
Important key performance indicators such as PUE (Power Usage Effectiveness) or CER (Cooling Efficiency Ratio) can be readily evaluated via all power supply or heat supply paths. The representations of summation power such as EDC (Energy Consumption Datacenter) or EIT (Energy Consumption IT) are not a problem for GridVis® and can be readily visualized with prepared objects.
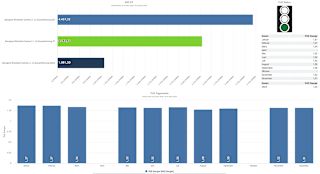
Energy efficiency dashboards
With GridVis® power grid monitoring software, certified in accordance with ISO 50001/50006, you can evaluate your PUE as well as other key performance indicators, such as EnPIs (Energy Performance Indicator).
- Create individual performance indicators
- Calculate and visualize directly in the software
- Show changes in key performance indicators using the trend and evaluation system
- Monitoring of energy efficiency

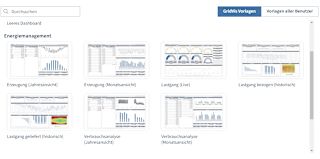

Energy efficiency analysis objects
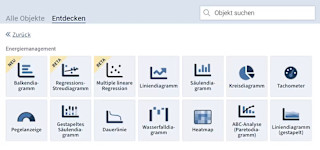
So that you always have the measured values to hand, GridVis® offers a range of visualization objects for user-friendly analysis. The objects can be stored on individual dashboards or in reports.
Dashboard and report editor at a glance:
- Large range of objects for visualizing KPIs and measured values
- Display of historical values and live data
- Freely selectable time periods
- Presentation mode for continued display of the most important data

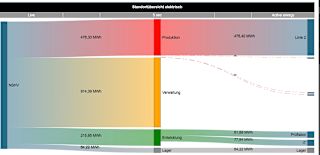


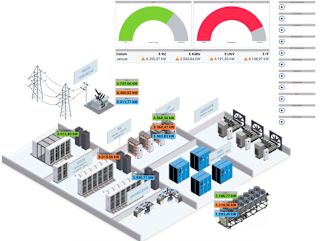
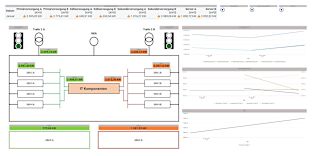
Individual topology pages
Summary pages with live measured values and alarm indicators are extremely helpful so that operations can draw conclusions, such as in critical situations, as quickly as possible. In this case, the data center can be granularly visualized in any manner from the primary supplies to the final circuits.


Monitoring electrical high availability
Timely recognition of voltage events means weaknesses can be detected and unscheduled shutdowns can be avoided. Power quality must be monitored according to normative specifications such as EN 50160, EN 61000-2-4, IEEE 519 and ITIC (CBEMA). The combination of Janitza network analyzers and GridVis® provides prepared power quality reports and special tools for evaluating electrical high availability.
Electrical availability
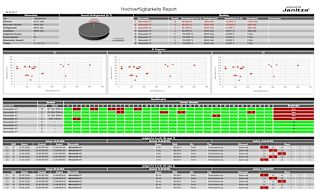
With GridVis® it is possible to monitor and evaluate electrical high availability. The high availability report makes it possible to summarize many measurement points in one report. It is ideal for complex power supplies with several redundancy paths.
The high availability report at a glance:
Evaluation of all critical nodes in one report
- Clearly shows at which point of the power supply system a failure has occurred
- Voltage availability with absolute downtimes and percentage values
- Calculation of the mean time between failures (MTBF)
- Evaluation of causes and impacts through a simultaneous display arrangement of the events
- Statements to be made about selectivity or the start time
- Show statistics on the affected phase conductors and determine the phase on which the short circuit or ground fault occurred
- Monitoring of warranted availability times

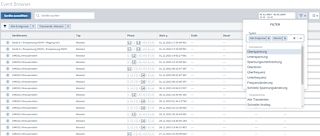
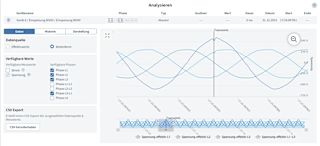
The event browser provides a comprehensive overview of the voltage, current and frequency events that have taken place. The precise illustration of processes, combined with key information and measured values, enable the event browser to provide accurate analysis of all events. This also provides an ideal foundation for monitoring what are known as catcher systems. Catcher systems are systems that need to switch between two paths in a very short time virtually without interruption. The event browser at a glance:
- Overview of voltage, current and frequency events
- Graphic evaluation of events and transients
- Recognize and analyze temporal relationships
- Search for event types or measurement points with the search and filter function
- Integrated CBEMA/ITIC curve (Computer Business Equipment Manufacturers Association)


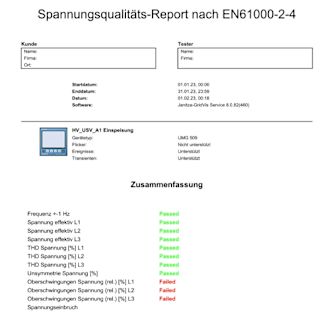
Power quality reports
The power quality in the ancillary supply equipment not provided by the electric utility must comply with Class 2 according to the EN 61000-2-4: 2002 standard, while Class 1 applies between the UPS and protected sockets. Compliance with the compatibility levels defined in EN 61000-2-4 must be 100%. GridVis® generates automatic reports that evaluate all grid compatibility levels in compliance with all relevant standards and also describe the quality of the voltage provided. These include, for example, the voltage distortion, individual harmonics, frequency and voltage.

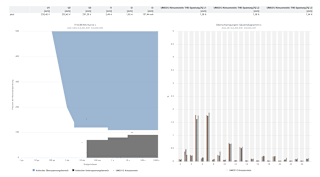
PQ objects
Any events and transients that occurred can be conveniently summarized on your dashboards with the Power Quality objects. For example, the ITIC (CBEMA) object can be used to compare events that occurred with the tolerance limits set out in the standard.


Redundancies and nominal currents
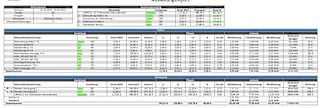
The utilization report from GridVis® means nominal currents over the entire power supply system with primary and final secondary distributors can be displayed and evaluated. The report shows, in tabular form, the utilization of all selected measurement points whilst taking the safeguards and MIN/MAX into account.
The utilization report at a glance:
- Phase and neutral conductor currents across the entire power supply from the main supply to the secondary distributors
- Utilization of all selected measurement points in percent and with absolute values
- Limit violations, excessive utilization and reserves can be seen at a glance
- Free configuration of related feeds
- Display redundant pairs and room totals
- Selection and setting of the period
- Currents incl. N, COSPHI, power and energy in a single view

Fire prevention and EMC
In addition to energy transparency and power quality, residual current monitoring (RCM) also plays an important role and is a requirement in standards for data centers.
The functionality of TN-S systems can be monitored and logged using a comprehensive residual current monitoring system. Fires due to insulation faults and failures can be detected and prevented before they occur. Insulation measurements as part of the retest can be omitted and the resulting downtime can be reduced considerably. GridVis® provides many options for analyzing residual currents in detail.
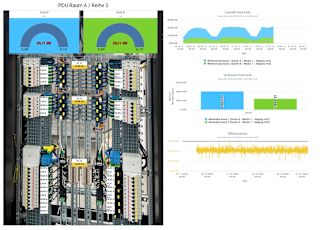
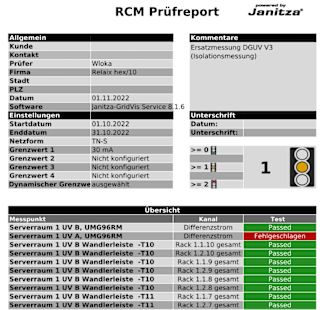
RCM report
The RCM report provides a quick overview regarding the state of your power supply and differential currents. The clear color-coding enables quick statements to be made. In addition, the report is useful when satisfying the need to provide verification. Alongside the standard report, it is also possible to create customized RCM reports such as those with additional evaluations and courses of frequencies, types of residual currents and the power associated with them.
The RCM report at a glance:
- Meaningful statistics on exceedances of limit values for residual currents and operational interruptions
- Support for system testing and the obligation to provide verification
- Status overview with signal colors for a general overview
- Status report on the insulation properties of the power supply system

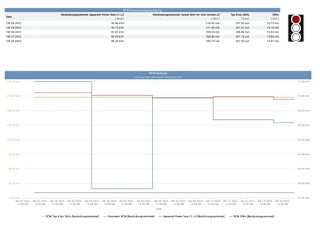

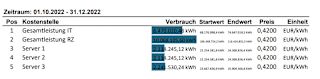
Cost center management
In colocation data centers, cost centers must be established and their energy metering values must be provided on a monthly basis. With MID measurement devices such as the UMG 96-PA-MID+ or MID- direct meters, the values for individual racks or rental areas can be recorded, charged and assigned to customers by means of cost centers. GridVis® provides prepared reports or flexible raw data exports to this effect.
Cost centers
GridVis® can also be used to assign several measurement points to a customer and calculate totals by means of virtual measurement devices. Extensive energy reports and data exports as well as a customized energy bill can also be generated.
Professional energy bill creation at a glance:
- Energy bills with an itemized table
- Optional column display with column name
- Addresses, information and labeling fields
- Individual customer logo
- Price groups with additional information
- Output of the extra reactive energy
- Fixed and relative costs
- Bar chart for history and comparison period
- Additional tables for history and comparison period
- Item markers for limit violations
- Energy variable as an area ratio
- XLS, XLSX or PDF file with power values (AVG, MAX), electrical energy values and user-defined energy values (e.g. gas, water, oil)