Application within industry
The industry must handle various challenges. GridVis® power grid monitoring software helps you get to grips with them. GridVis® helps you in all ways whether energy management in accordance with ISO 50001, supply security or reporting carbon emissions.
Numerous functions for visualization and evaluation of your energy data help provide you with an overview of all key information at all times. Standardized reports in accordance with numerous standards make both documentation and analysis easier. This does not just provide a foundation for energy management that complies with relevant standards and ensures a secure power supply, but it is also a basis for reducing your energy costs.
ISO 50001
ISO 50001 made easy
Energy management in accordance with ISO 50001 is required in many industrial sectors, such as in the form of legislation or as a customer requirement. The recording and evaluation of energy data is a key part of energy management. It is the only way to decide on necessary measures and to illustrate successes.
Alongside the measurement technology for recording data, Janitza also provides the corresponding software to prepare and evaluate your energy data in line with applicable standards.


Energy sources & auxiliary materials
In GridVis® you can display all energy sources & auxiliary materials in a single item of software, e.g. water, gas, compressed air or nitrogen. GridVis® provides a wide range of options regarding data import to this effect, such as via CSV, a direct connection between meters and measurement devices via Modbus or OPC-UA.
In addition, various energy sources can be automatically converted into the energy equivalent (e.g. cubic meters of gas into kWh) by storing contract files with all relevant information.
- Illustrates all energy sources & auxiliary materials
- Simple integration of measurement devices and meters via Modbus.
- Quick and simple integration of Janitza meters
- Simple data import via CSV or MSCONS as well as manual data entry
- Store contracts and easily calculate consumption values with standard conversion factors
- Virtual devices for summarizing and calculating data from all measurement levels

Data preparation
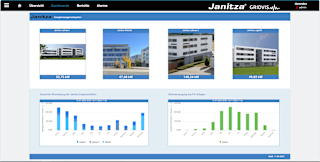
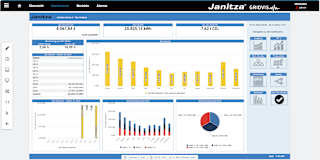
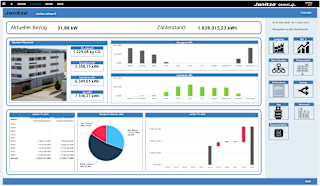
The reporting and dashboard tools provided by GridVis® helps you keep track of your measurement data. Individually customizable dashboards help provide a quick overview whilst the reports provide fast, standardized documentation, even for audits. Automated functions also simplify documentation and reduce the workload.
GridVis® also provides assistance with evaluation, such as in the form of regression analysis for trend spotting, the KPI editor or functions such as Sankey diagrams or VDs (Virtual Devices) for plausibility checks.
- Transparent data preparation for audits
- Creation of standardized or customized reports in compliance with relevant standards
- Automation of reports and reporting
- Quick summary with individually customized dashboards
- KPI editor and analysis in accordance with ISO 50006
- Evaluating trends with regression analysis
- Plausibility checks with Sankey diagrams, virtual devices or commissioning report

Integration
GridVis® provides various integration options and secure encryption. This simplifies integration into your systems.
- Availability of various interfaces (REST API, OPC UA)
- Security in the form of TLS encryption (https)
- Support of Windows Server services (e.g. Active Directory)
- Use of in-house databases: MySQL, MSSQL
carbon emissions
Emissionen spielen eine immer wichtigere Rolle und müssen z.B. für gesetzliche Regelungen erfasst und bewertet werden. Als Zulieferer sind auch kleinere Unternehmen zunehmend von solchen Anforderungen betroffen.
Carbon emissions
GridVis® simplifies the complicated process behind evaluating carbon emissions. Data imports and inclusion of meters via Modbus enable integration of all energy sources & auxiliary materials into the software. You can store contracts and convert all your consumption values directly into carbon emissions via contract management. This makes it simple to prepare analysis of consumption, costs and carbon emissions and to have your values displayed in a media-related manner.
- All carbon emissions in one item of software
- Includes all energy sources and auxiliary materials
- Simple conversion of consumption values into carbon emissions via stored contracts
- Generating key performance indicators with the KPI editor
- Carbon emission analysis as well as analysis of consumption and costs

Overview of all data
GridVis® dashboards and reports provide you a quick overview of all your consumption, costs and emissions. Reports and dashboards can be fully customized via the editors. This enables you to obtain a qualified statement about your carbon emissions at any time. Automation functions simplify documentation.
- All data at a glance
- Media-related display
- Individually customizable dashboards and reports
- Automated reporting for simple documentation
Security of supply
Security of supply is essential in many industrial areas. Even momentary periods of downtime and errors in power supply can result in high costs and serious damage. Problems with power quality represent a potential risk. The power quality must be monitored in compliance with standards to ensure a secure supply.
Avoid disturbances
GridVis® helps detect issues with power quality in good time so that damage to systems and downtime can be prevented. Clear dashboards provide a simple illustration of power quality whilst numerous alarms can be used to monitor limit values.
Personalized dashboards can be created with GridVis®. A range of power quality objects makes power quality clear at a glance whilst also helping you keep sight of absolutely everything that is happening within your facilities.
- Get an overview quicker with customized dashboards and status displays
- Power quality objects for ease of evaluation
- Dashboard templates and simple integration of various measurement points
- Visualize complex relationships clearly
Set alarms so that you are informed at all times if limit values are exceeded or other events take place within your facility.
- Instantly establish issues with power quality
- Alarm function for limit value monitoring of selected measured values
- Email dispatch in case of alarm
- Execution of external programs in case of alarm
- Monitoring of consumption as well as device communication
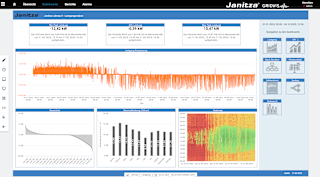
The event browser enables you to carry out accurate analysis of all events and transients. Voltage curves, important information and measured values are clearly shown.
- Provide a clear overview of voltage and current events from a selected period
- Graphic evaluation of events and transients
- Recognize and analyze temporal relationships
- Search for event types or measurement points with the search and filter function
- Integrated ITIC curve (CBEMA)
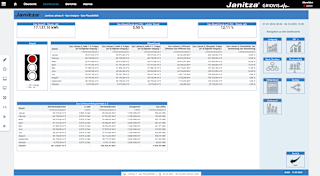
GridVis® reporting provides assistance when evaluating and displaying your measurement data in accordance with relevant standards. Standardized reports provide evaluations directly in accordance with standards whilst directly showing faults or issues with the power quality. Reports can be individually customized in line with your needs to satisfy your individual requirements.
You can have reports automatically created at regular intervals. This makes documentation and compliance with verification requirements far simpler.
- Simple evaluation with prepared reports
- Simplified documentation with standardized reports
- Create customized reports
- Automatic generation of reports with automation rules
- Generate evidence showing compliance with standards
- Data storage takes place in GridVis® for greater data security